Scientists estimate that there are 8.7 million species ( ~15% margin of error) on this planet. We have identified 1.3 million species so far. This includes everything from mammals and reptiles to plants and algae. However, from a human perspective, our immediate surroundings don’t seem that diverse. Especially if you live in cities. We’ve spent so much of our time and effort in creating a predictable environment and ecosystem for ourselves in our cities, with plants and animals that are beneficial to us, according to our understanding.
The earth exists in a complex system of inter-related systems that have feedback loops with each other. It is inherently difficult for humans to comprehend this complexity, This lack of comprehension, coupled with our deterministic and simplistic models of how the world works from the past have generated a lot of the world’s troubles today.
Context
As we saw before, there are potentially 8.7 million species on this world. However, they are not spread evenly across the world. The distribution of the number of species is again dependent on complex systems of climate, geology and the evolutionary history of the planet. These patterns are referred to as “ecoregions”.
WWF (yes, that wildlife organisation with the panda logo) defines an ecoregion as a “large unit of land or water containing a geographically distinct assemblage of species, natural communities, and environmental conditions”.
The WWF has identified terrestrial, freshwater, and marine ecoregions. The terrestrial scheme divides the Earth’s land surface into 8 biogeographic realms, containing 867 smaller ecoregions. Each ecoregion is classified into one of 14 major habitat types, or biomes.
If you are trying to map these ecoregions, the boundaries get quite interesting. Like everything in nature, there is not a clean line where one ecoregion ends and other begins. An ecoregion encompasses an area within which important ecological and evolutionary processes most strongly interact and it is an approximation at the local level and at the borders.
The reason WWF categorized these ecoregions is to bring attention to the fact that unique manifestations of nature are found in temperate and boreal regions, in deserts and mountain chains as well. While it is important to protect tropical forests and coral reefs that have the most biodiversity, we shouldn’t be utilitarian in conservation efforts to maximize species conservation and ignore ecoregions that are less biodiverse, but are unique nonetheless, which are at risk of being lost forever if they are not conserved.
Idea
So, the idea for this map comes from a course I am currently taking at my masters in TU Delft. The course is called Infrastructure and Environment Design. The course has a very interesting component called critical cartography, where we try to analyse the context of a case using cartographic explorations in distinct perspectives. My perspective of choice is systems of systems, where we try to understand the complex systems at play that we just described at the beginning of this article.
One such exploration was to see existing political and administrative boundaries and their relationship to ecological boundaries. We are studying the city of Bhuj for the course and to understand this, I was trying to find the ecological regions in Gujarat and that’s how I came across the ecoregions as defined by WWF.
Now, with this information, I wanted to map the whole of India.
So the story of how independent India created the borders for its new states is a fascinating one. There was so much political drama involved. To give a short summary, in the early 1950s, the states reorganisation commission proposed new state borders based on linguistic lines to reorganise the provinces in India post-independence. The argument was to limit caste / religious identities and promote less controversial linguistic identities.
From what I’ve read in Tamil literature, the culture of people during the Sangam era was intertwined with the geography of the land and was described in the Sangam landscapes of four geographic(Kurinji, Mullai, Marutham, Neithal) and one imaginary landscape(Paalai), which were used as poetic devices as well. The names are that of distinct species of flowers that grow in these regions, thus signifying a distinct ecoregion as well.
So with these three pieces of distinct, yet interrelated information, I wanted to see what if the states were based on ecological regions and not on linguistic lines?
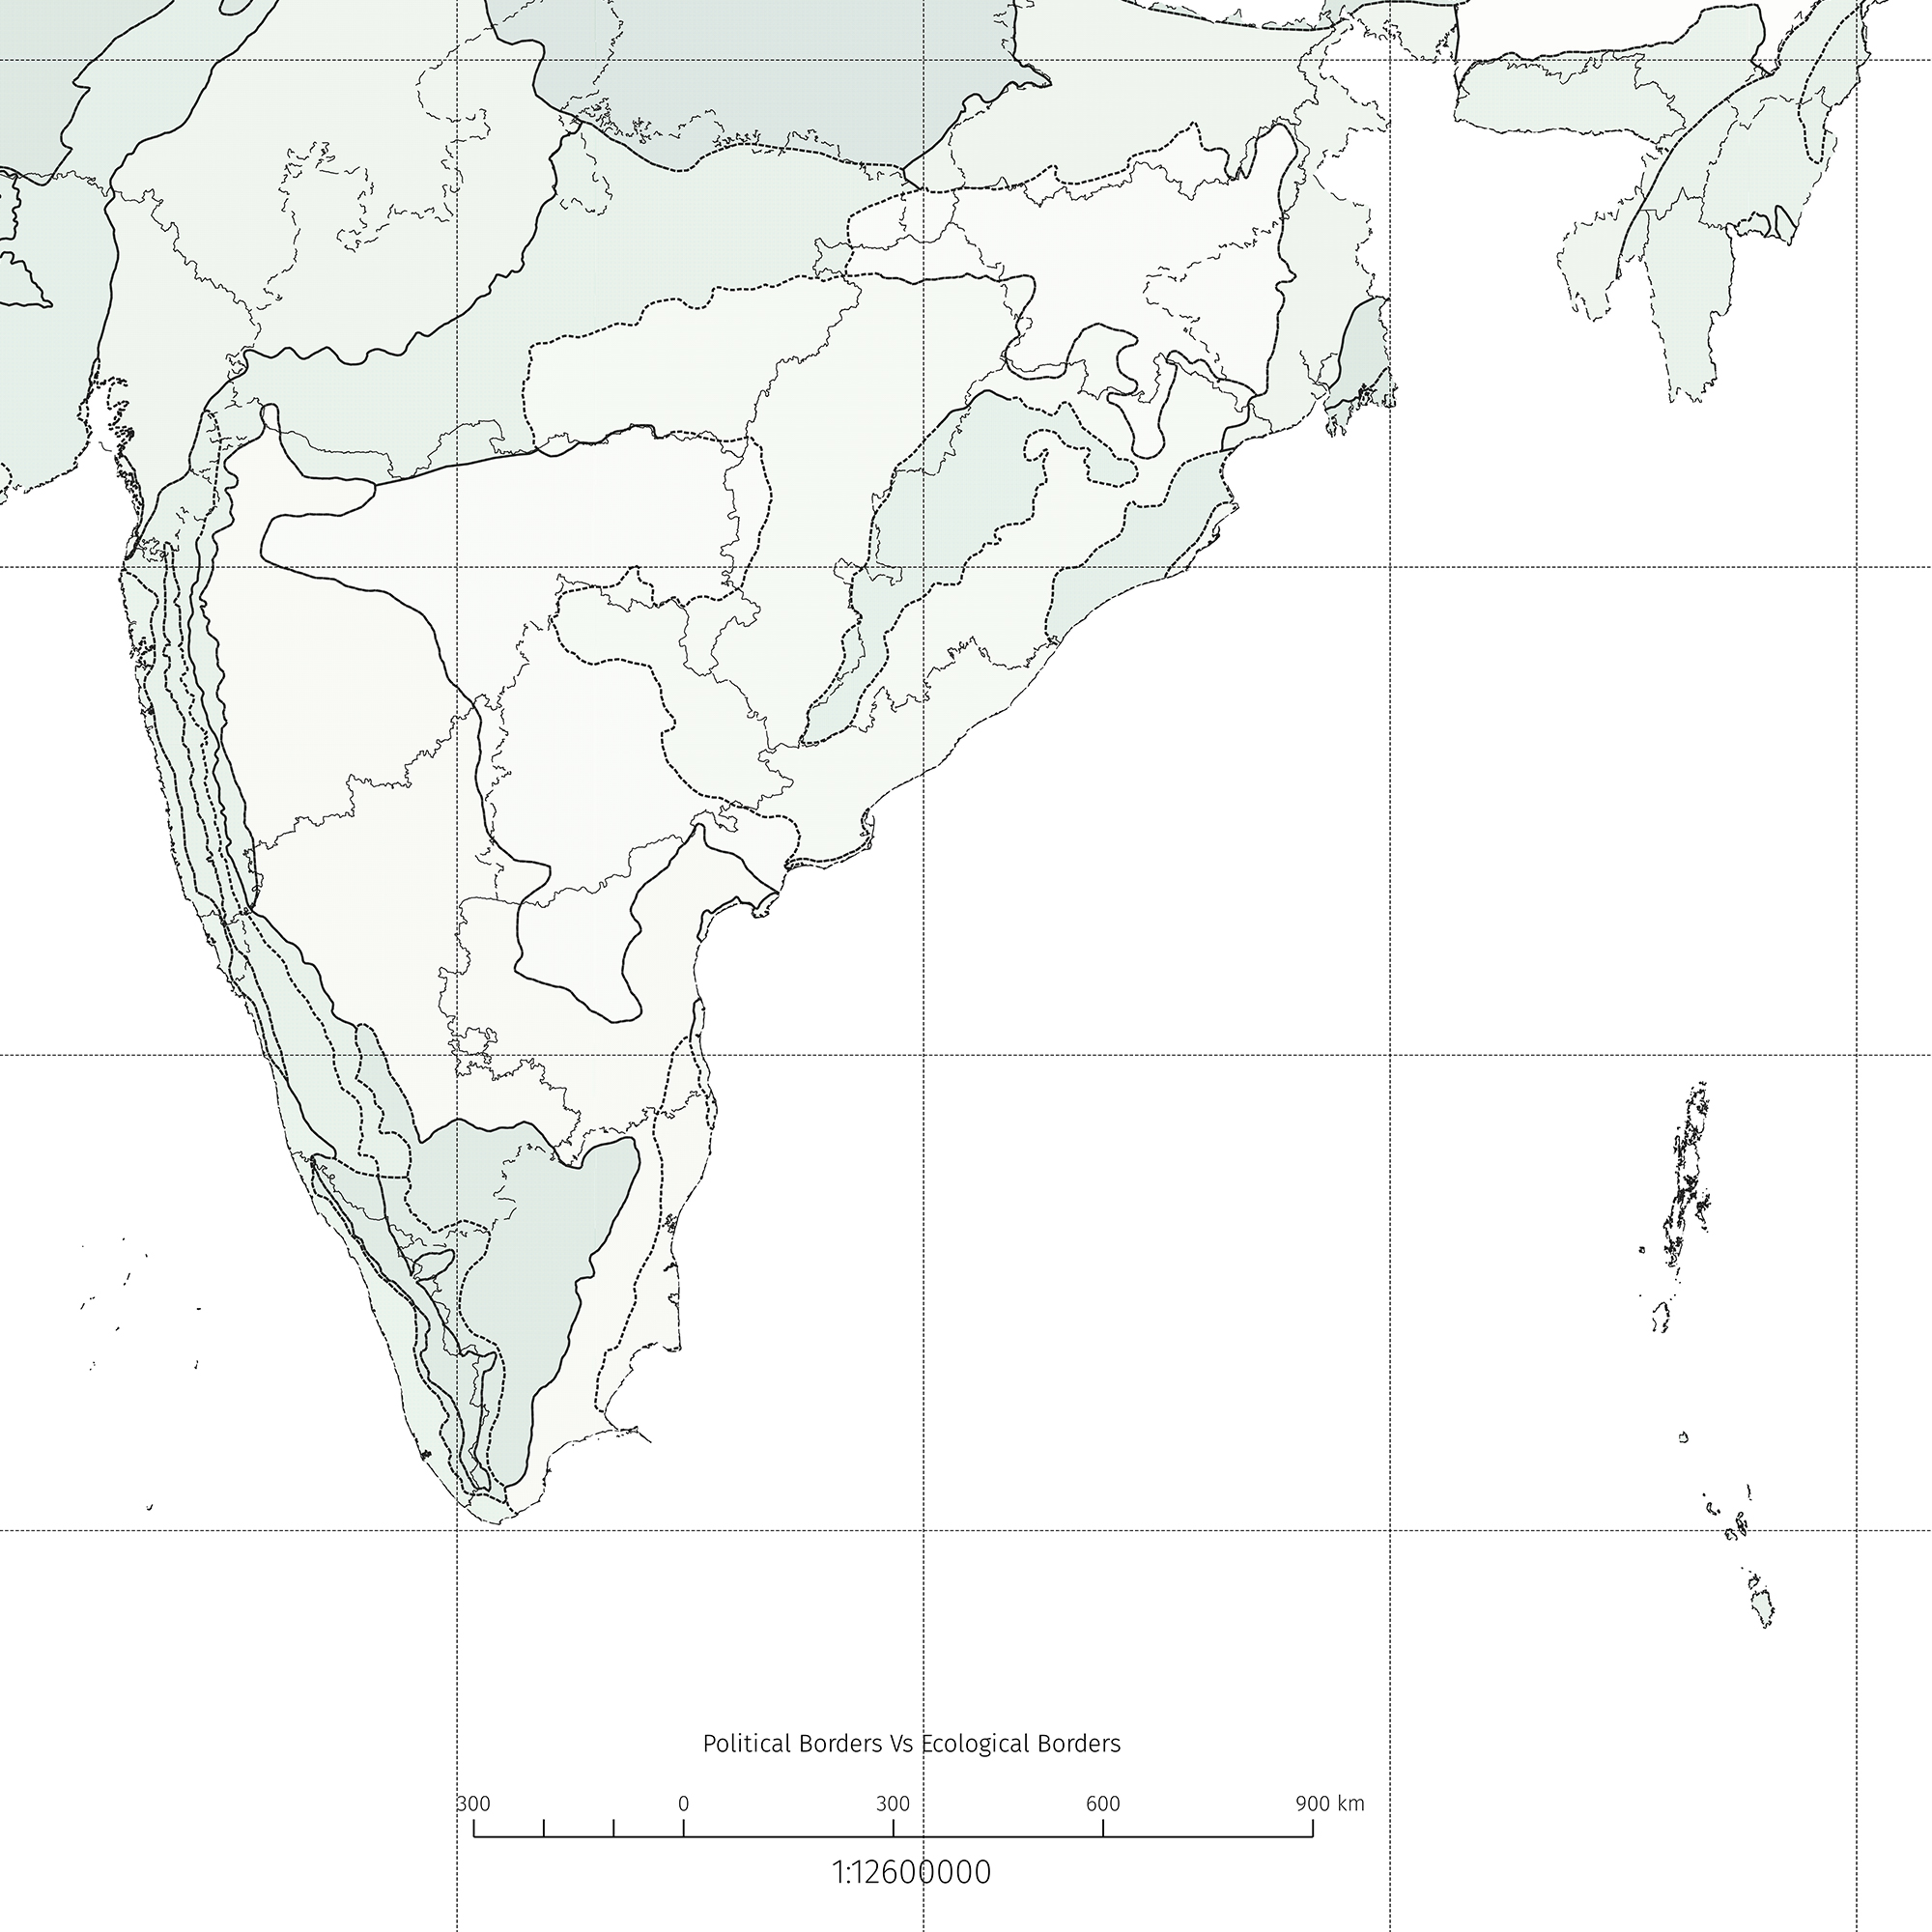
A speculative cartographic imagination of an India along ecoregions. Ecoregions as administrative units could potentially lead to lesser conflicts in terms of sharing of resources and conservation of nature and culture. If ecoregions are administrative units as well, they can understand their strengths and weaknesses better and develop policies and projects for economic development that are not always at odds with the conservation of nature. An ecoregion split across states requires concerted efforts from multiple stakeholders that is difficult to achieve today and a holistic understanding of a pan-territorial entity is lost because administrative units don’t have incentives to understand them better.
Process
The first step would be to collect all the spatial datasets. WWF has a publicly available dataset of the Terrestrial Ecoregions of the World (TEOW), that makes this whole project 90% done. I generally use the Database of Global Administrative Areas for country boundaries for my maps. However, their version of India doesn’t include disputed territories in Kashmir. Yes, I want to speculate with borders, but I figured one challenge is good enough at the moment and went with the crowdsourced version of the India states boundary released by the people at DataMeet, which is closer to the official version recognised by GoI. It still doesn’t include the recent boundary changes with Dadra and Nagar Haveli and Daman and Diu (that would probably be the highest number of ‘and’s in a place name) and Jammu and Kashmir.
I overlayed these datasets on QGIS, our trusty open source GIS software and played around with it to reach a balance between readability and aesthetics. My exploration with cartography started as an aesthetic pursuit to make good looking maps, so that plays an important role in how I make maps.
 To make it easier to comprehend the relationship between ecoregions and states, I made a Sankey diagram on Flourish. You can download the CSV file to play with the data if you are interested. 43 ecoregions vs 36 administrative units.
Notes
This was a fun side project for me to explore the absurdities of borders. I am thinking of making more maps questioning the nature of borders, and combine them with my thoughts on the same. This map is a work in process. I am thinking, adding major cities would make it more comprehensible. A legend would definitely help in reading the map better.
If you have any thoughts and suggestions, feel free to comment and let me know. If you are interested in collaborating on these maps or want to buy a print, you can always reach me on my social media pages or send me a good ‘ol email. You can buy me a coffee to support my work.
If you have read till the end, you know the drill! Share it with someone who’d think this is interesting. Have a great day or night(?)!
Great blog! Only thing I would not agree with you is that palai is not some imaginary place. The present day consensus is that there is no permanent palai land and changes in the original state of other lands lead to palai. Could you please explain me why do you think palai is imaginary?